


what you need to know about MNF
(spoilers: its not as hard as you think)

I use Market Net Flow (MNF) everyday to inform my trading.
In my opinion, it is the best tool on the Tradytics platform and worth your consideration, every day.
It might look complicated, but it really isn’t.
Here’s everything you need to know about it, *roughly* simplified
**Disclaimer: This is for educational purposes only and is not meant to be taken as financial advice. You are required to do your own due diligence. You MUST always manage risk when investing in financial markets.**
The basics:
Green line = Call premium spent on (filtered) equities
Red line = Put premium spent on (filtered) equities
White line = Current day’s price of SPY
When the green line is above the 0 line, that means more Calls are being BOUGHT than sold. When the red line is above the 0 line, that means more Puts are being BOUGHT than sold.
The inverse is also true.
When the green line is below the 0 line, that means more Calls are being SOLD than bought. When the red line is below the 0 line, that means more Puts are being SOLD than bought.

Now why is all that important? Because if we know the direction of the options flow, we can use that against what we know to be true about dealer hedging.
All that flow must to be hedged in real time by dealers.
Once the transaction is completed, to stay delta neutral, dealers will need to hedge the delta of all that options flow, IN REAL TIME. This is why MNF is a day trading tool!
Here is a cheat sheet of how they do that:

To simplify:
If participants are buying Calls, dealers are hedging by buying stock
If participants are selling Calls, dealers are hedging by selling stock
If participants are buying Puts, dealers are hedging by selling stock
If participants are selling Puts, dealers are hedging by buying stock
Read that again a few times. It can be hard to wrap your head around it at first, as it is counter intuitive. But with enough time spent learning to understand it, it will start to click.
So what is the best way to use MNF?
When there is clear Divergence. Any MNF chart that has major divergence means that dealers are hedging in the same direction for Calls and Puts.
If you look back at the cheat sheet you can see that:
If participants are BUYING Calls and SELLING Puts, dealers are forced to hedge by BUYING
If participants are SELLING Calls and BUYING Puts, dealers are forced to hedge by SELLING
The more divergence the better.
Let’s take this example of Divergence from January 6th 2023

Calls > Puts, Puts below 0 line. Dealers are forced to hedge in a way that supports upside movement in the market, hedging that delta by BUYING.
Let’s look at the inverse from December 6th 2022
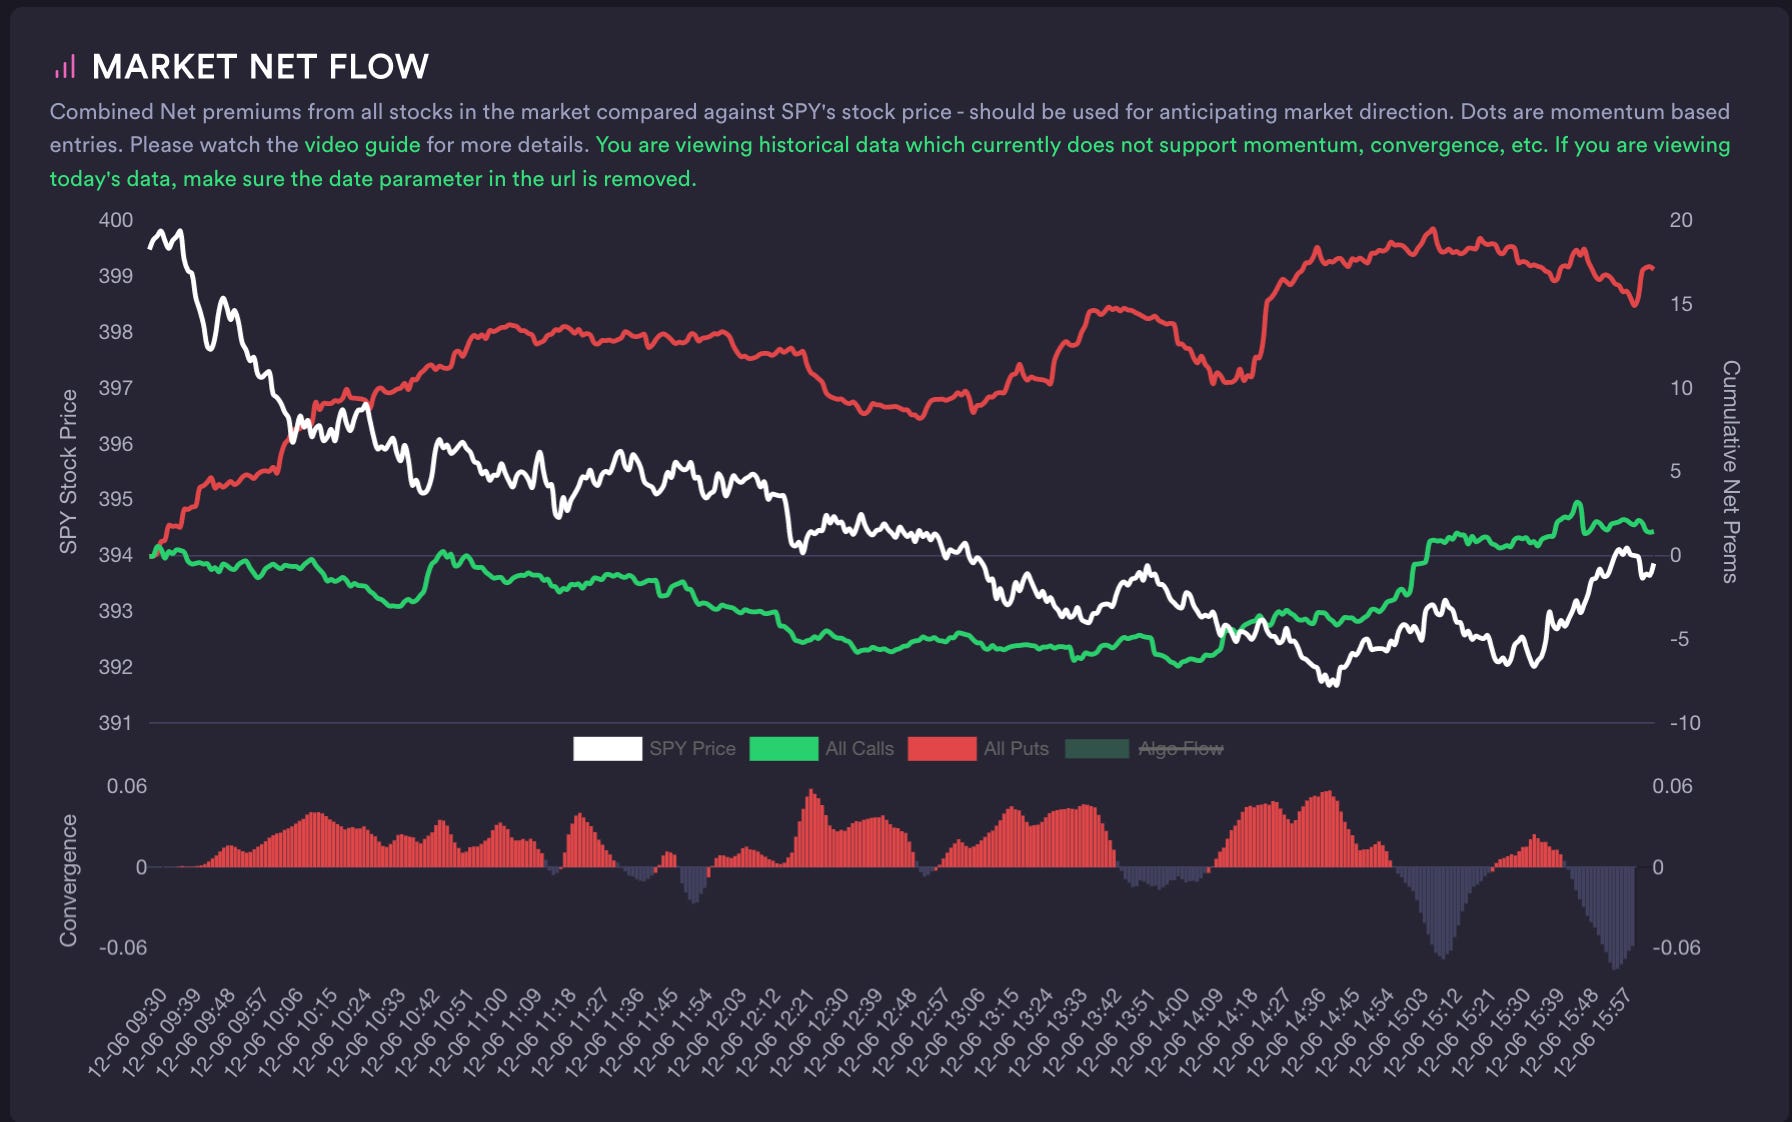
Puts > Calls, Calls below 0 line (for most of the day). Dealers are forced to hedge in a way that supports downside movement in the market, hedging that delta by SELLING.
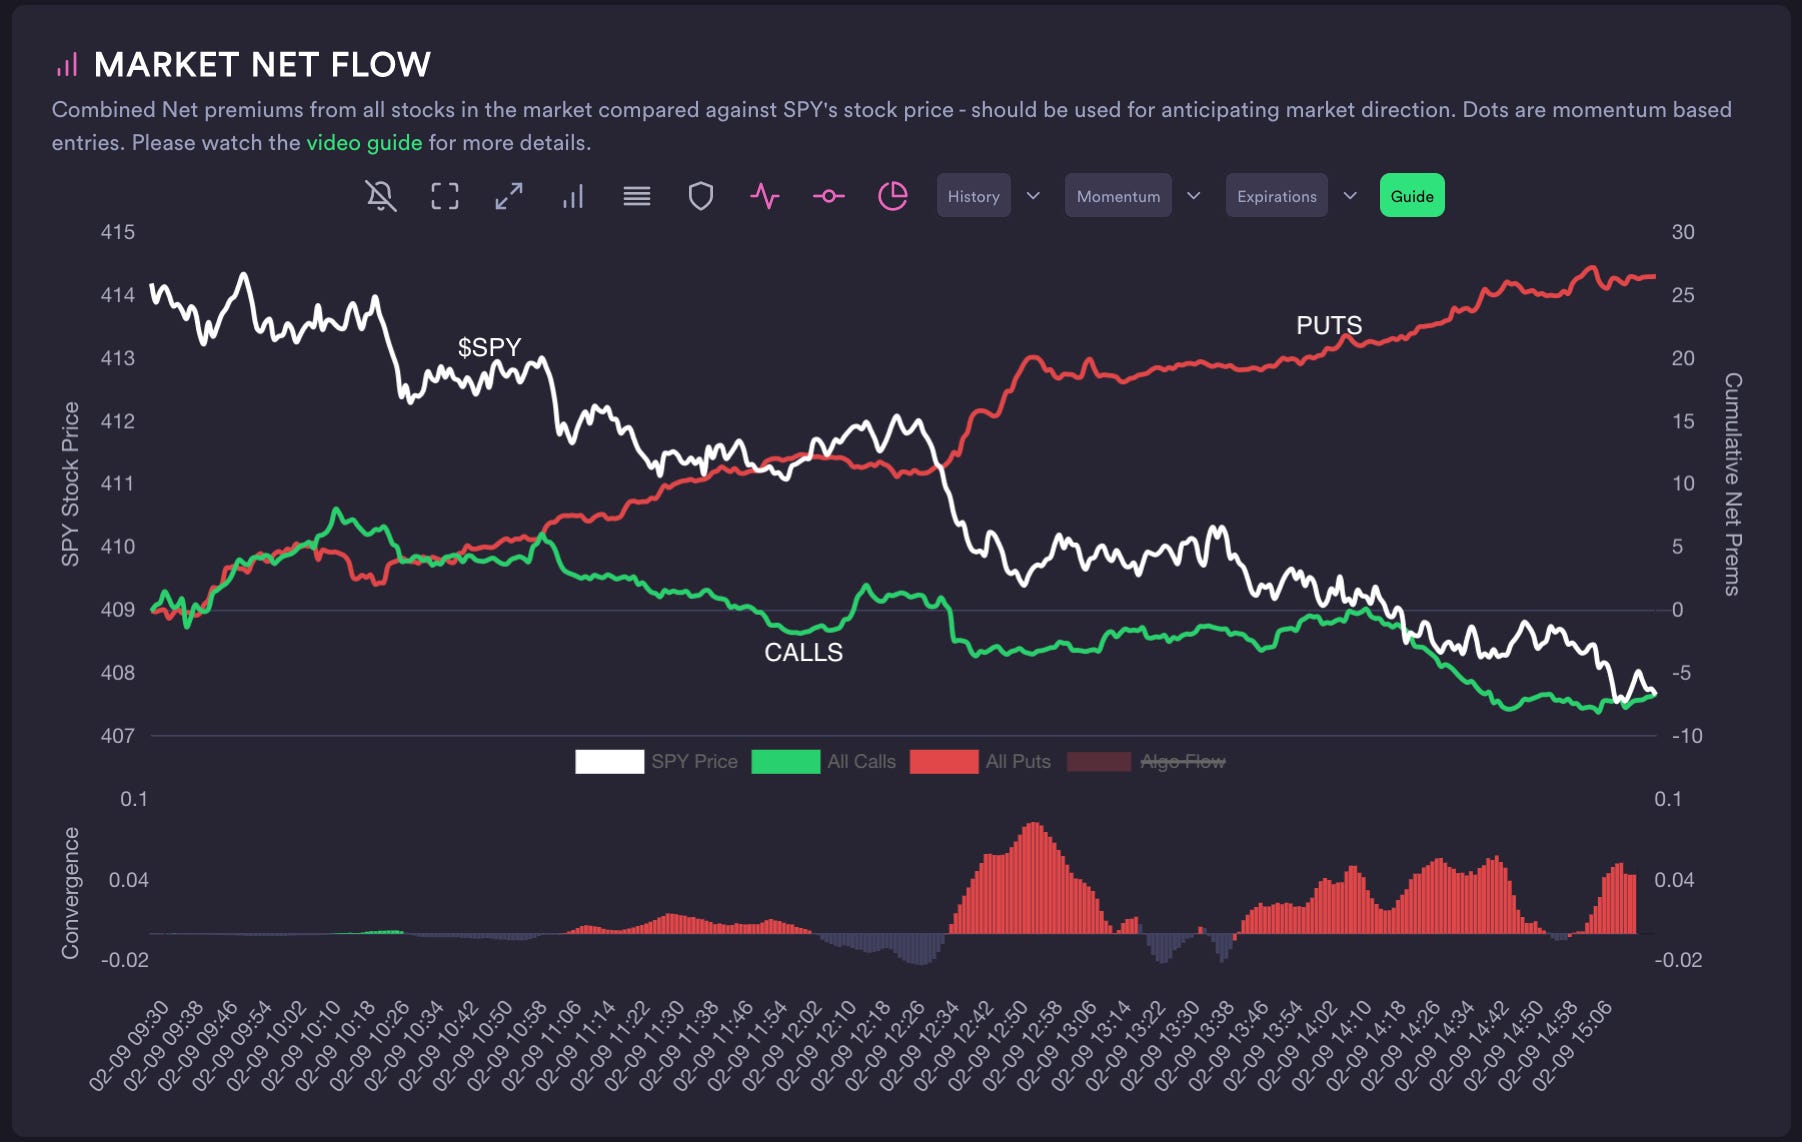
Let’s take a look at an example when there was no clear divergence from February 6th 2023

Both Calls and Puts are being bought, forcing dealers to hedge in different directions. That turns out to be a pretty choppy day in terms of price action.
Now ask yourself, which MNF chart would you rather trade? The one where we know that dealers must hedge in the same direction? Or one where we know they are being forced to hedge in different directions?
Convergence Tool
When we have clear Divergence on the MNF chart, using the Convergence tool can be helpful for timing entries. But be careful, it is not perfect. You must manage your risk. Never blindly assume any tool works perfectly.
Bullish Divergence + Convergence

Bearish Divergence + Convergence

The Convergence tool is an indicator that is useful when everything on the MNF chart is in alignment.
When Convergence is green, it is indicating that Calls are over Puts and that Tradytics’s proprietary algorithm is also bullish.
When Convergence is red, it is indicating that Puts are over Calls and that Tradytics’s proprietary algorithm is also bearish.
When Convergence is grey, it means we are out of alignment. There are contrarian entries to be taken when Convergence is grey, but if you are a new trader, I would recommend staying away from those trades.
To toggle the Convergence tool on, make sure you have this icon selected:

APPLICATION AND REVIEW
Step 1: Identify Divergence. If there is no Divergence, there is no edge. Wait patiently. Step 2: Once Divergence is identified, look for high probability entries in the direction of dealer hedging.
Step 3: Always manage your risk
ADDITIONAL COMMENTS
Portfolio managers and Funds tend to use Puts for protection, and not to move the market. Think insurance on your automobile. It sucks to pay monthly premiums for your automobile, but it comes in handy when you need it.
These Puts tend to be longer dated and further OTM, which have less of an impact on dealer hedging, as they have smaller deltas and “usually” DO NOT end up ITM.
Call buying and selling “tend” to have more impact on dealer hedging which “can” have a greater impact on the market.
I always want to see what Calls are doing, as “smart money” uses Call buying and selling to push the market around. It’s a reflexive loop.
ADDITIONAL COMMENTS
Keep an eye out for when flow “flattens”, as dealers are not forced to hedge during this time. This “tends” to happen when Wall Street is “out to lunch”. Just like in times of low volume, this can correspond to choppy price action and/or times when the price of the stock can be heavily manipulated.
BONUS CONTENT
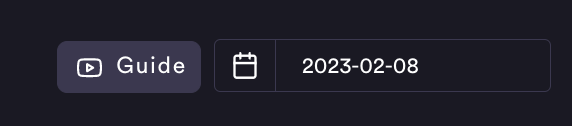
I suggest finding clear trend days in the market and using the calendar tool in the upper right hand corner of the page to see how MNF performed on those days. What confluence/correlations can you find? This will help you use MNF in real time. Do your homework!
Also, watch the video on MNF by clicking on the Guide button or visiting the Tradytics Youtube page: Tradytics
I also use the WEEK TO DATE option after Mondays to see if there is any change in the behavior of flow participants. This tool can be helpful when looking at the overall structure of flow.

This is a foundational understanding of MNF. More time spent using the tool will lead to more experience and confidence using MNF.
I’ll leave you with this statement from one of our community members:
“Only a bad carpenter blames his tools”.
Get to work! ❤️
-Matthew
This is pretty dope! Love the way you added examples to illustrate how to best use it.
Thank you Matthew. Very helpful